

The following is a guest post by Dryden Williams, co-founder at EcoPing.
Every part of a company’s digital footprint—from the fonts and images to the CSS and JavaScript on every web page—produces CO2. EcoPing is on a mission to help companies reduce that carbon footprint by monitoring their website and providing ways to reduce emissions over time.
In this post, I’ll share how and why we replaced a homegrown admin panel with Retool to accelerate our product development.
EcoPing offers customers a dashboard where they can see website carbon emissions over time, the environmental impact of the region where their website is hosted, and tips to improve their website’s environmental impact and overall performance.
When we first started, we used MongoDB to store users, teams, indexes, and the metrics from each page we track. We also built our own internal API to facilitate getting the right insights to customers faster.
Along with the internal API, we built an admin frontend for handling customer management, billing, and performing one-off actions. But this turned out to be a large time sink that was distracting us from our core mission. Many of the common endpoints were cumbersome in Mongo and much easier in PostgreSQL. Even with amazing documentation from Stripe, we still had lots of code for endpoints we knew we could remove, allowing us to utilize great features like Stripe Portal with less code to maintain ourselves.
Calculating our site averages took some complicated Mongo aggregations and left us questioning the numbers constantly. We knew we could do everything much quicker moving away from Mongo. On top of that, it also meant maintaining internal API endpoints which was extra code to maintain.
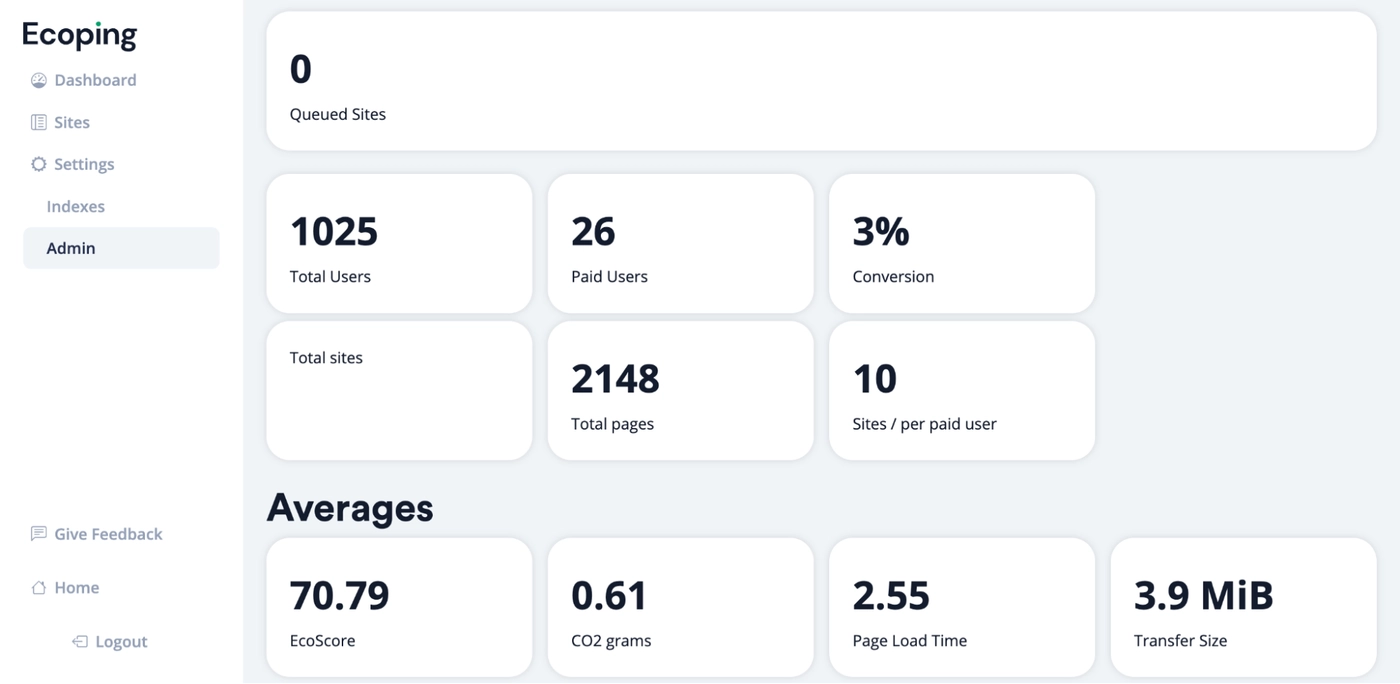
Still, it was incredibly useful to have these metrics visible to us. Seeing the “Total users” increase daily helped motivate the team. And knowing conversion rates helped assure us we were moving the right direction with the product. The website averages—based on the sites our customers uploaded to evaluate—allowed us to write content about the environmental impact and state of the web.
Ultimately we knew we needed a more efficient approach for handling internal operations that could yield us the information we needed without requiring us to maintain both an internal API and admin panel.
After two years of toiling with Mongo and our admin dashboard, we decided to move our primary data storage from MongoDB to PostgreSQL. It was a big overhaul, but writing our Mongo aggregations was getting more and more complex and messy—and we simply didn’t trust the output. Having prior knowledge of PostgreSQL we recognized we were trying to replicate many of the built-in functions PostgreSQL already had.
At the same time, we found Retool via a sponsored Golang newsletter and decided to pilot it to replace our homegrown admin panel. Our primary motivations were that Retool could connect directly to our internal database and that we could use Retool to drag and drop components into our dashboard very easily.
We found that we could even connect it to our REST API—everything we needed could be all in one place. Now, we use Adminer in our dev environments to introspect the database and test out simple queries. In staging and production environments, we use Retool’s built-in Query Library to test and manage important queries.
It took just a few days to replace much of our internal API and admin panel with Retool—and the results simplified our operations considerably. Retool just feels easier. If we want to add a new column to our data, it’s a few clicks away. If we want to offer customers data exports (a common request!) we can simply select “Download CSV” instead of doing anything custom.
Our Retool admin panel allows us to look through all of our data easily. We can ask and answer questions like, “What is the current average website carbon emissions?” in seconds. (For those wondering, it’s 0.74gCO2e per page view!)
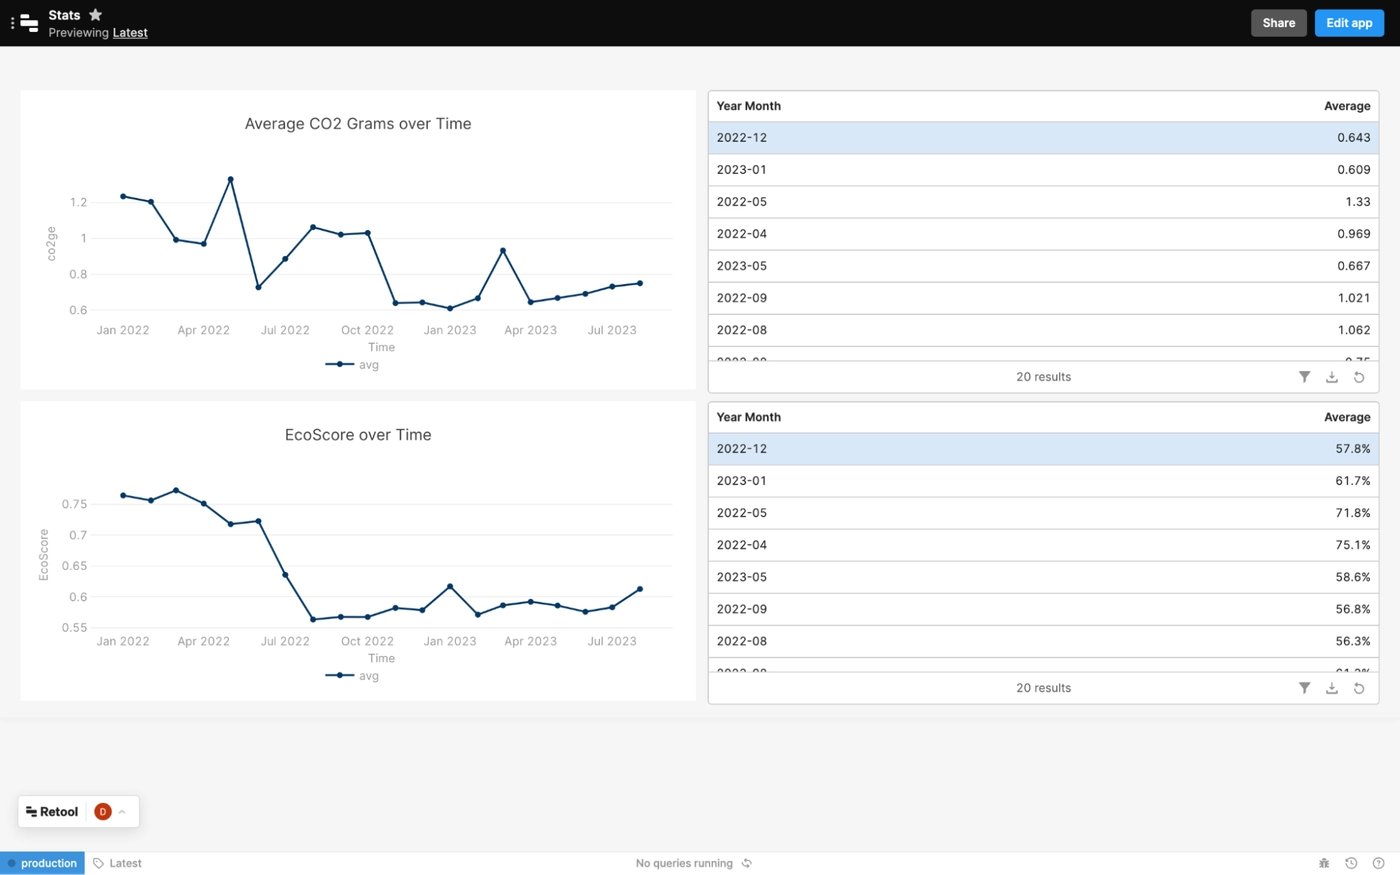
Retool has gone far beyond a simple admin panel for us. We’ve since built out customer website reports in Retool so we can see what’s going on behind the scenes, preview our aggregated weekly email, and send the email—all in a few clicks.
Every Retool app and workflow is highly functional code that we didn’t have to write, which means we now spend far fewer days per month building and maintaining internal tools. This gives us more time to chat to our customers—and to concentrate on building the features they need to reduce their website carbon emissions.